Project Overview
Project Overview
Project Overview
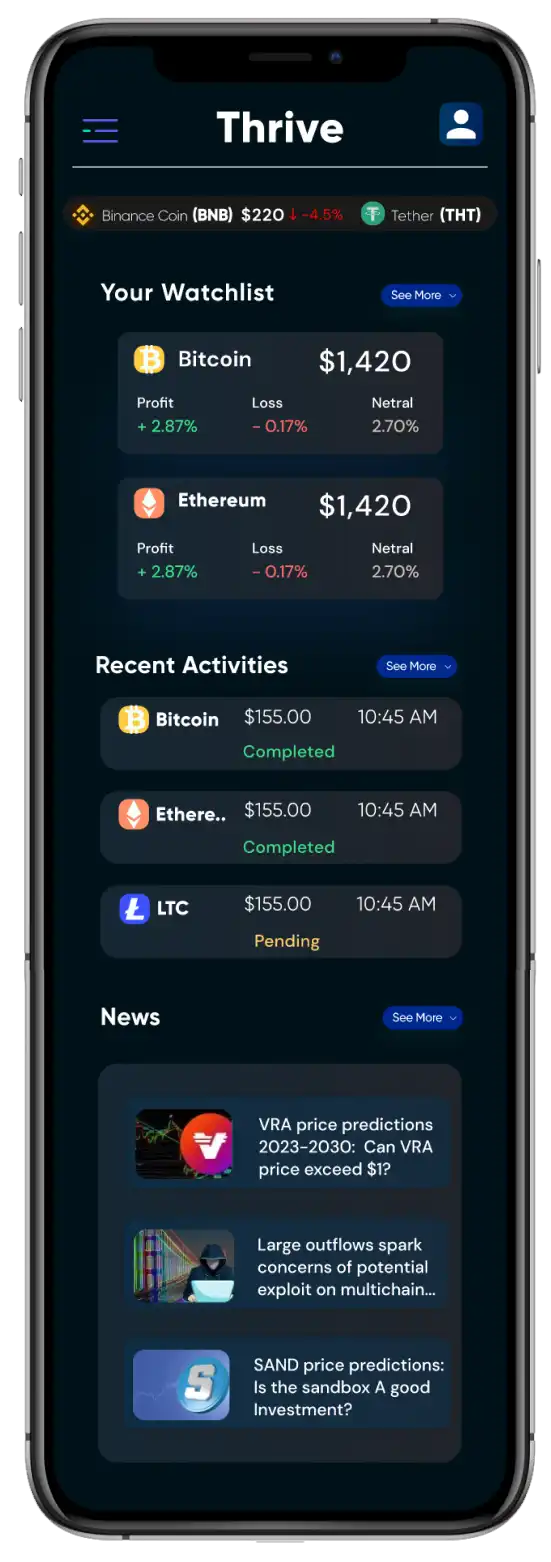
The challenge was to conceptualize and design the UX and UI of a dashboard for a web app including the mobile responsive design that helps users easily track their bitcoin investments at the same place.
The challenge was to conceptualize and design the UX and UI of a dashboard for a web app including the mobile responsive design that helps users easily track their bitcoin investments at the same place.
The challenge was to conceptualize and design the UX and UI of a dashboard for a web app including the mobile responsive design that helps users easily track their bitcoin investments at the same place.
Timeline
Timeline

Discover
Discover
Discover
To start off the design challenge, I had to get a quick understanding of how the cryptocurrency dashboard platforms primarily function and what features user use the most. To achieve this, I've looked at multiple existing designs on websites like dribble and also screenshots of commercial applications.
To organize and make sense of the insights, I categorized research objectives and answers into 3 sections to make it easy.
To start off the design challenge, I had to get a quick understanding of how the cryptocurrency dashboard platforms primarily function and what features user use the most. To achieve this, I've looked at multiple existing designs on websites like dribble and also screenshots of commercial applications.
To organize and make sense of the insights, I categorized research objectives and answers into 3 sections to make it easy.
To start off the design challenge, I had to get a quick understanding of how the cryptocurrency dashboard platforms primarily function and what features user use the most. To achieve this, I've looked at multiple existing designs on websites like dribble and also screenshots of commercial applications.
To organize and make sense of the insights, I categorized research objectives and answers into 3 sections to make it easy.
WHAT, WHY and HOW?
WHAT, WHY and HOW?
What: Understanding User Needs
Portfolio Tracking: Users need an easy way to monitor the value and performance of their cryptocurrency holdings in real time.
Market Analysis: Access to live market data, including prices and trends, is crucial for making informed investment decisions.
Why: The Importance of User Insights
Efficient Management: Clear and consolidated portfolio tracking helps users manage their assets efficiently.
Timely Decisions: Real-time market data enables users to make timely and informed trading decisions in a volatile market.
How: User Interactions and Preferences
Customizable Dashboards: Users appreciate being able to customize their dashboard view to highlight the most relevant information.
Intuitive Navigation: Simple and intuitive navigation is essential for users to access different features quickly and easily.
What: Understanding User Needs
Portfolio Tracking: Users need an easy way to monitor the value and performance of their cryptocurrency holdings in real time.
Market Analysis: Access to live market data, including prices and trends, is crucial for making informed investment decisions.
Why: The Importance of User Insights
Efficient Management: Clear and consolidated portfolio tracking helps users manage their assets efficiently.
Timely Decisions: Real-time market data enables users to make timely and informed trading decisions in a volatile market.
How: User Interactions and Preferences
Customizable Dashboards: Users appreciate being able to customize their dashboard view to highlight the most relevant information.
Intuitive Navigation: Simple and intuitive navigation is essential for users to access different features quickly and easily.
What: Understanding User Needs
Portfolio Tracking: Users need an easy way to monitor the value and performance of their cryptocurrency holdings in real time.
Market Analysis: Access to live market data, including prices and trends, is crucial for making informed investment decisions.
Why: The Importance of User Insights
Efficient Management: Clear and consolidated portfolio tracking helps users manage their assets efficiently.
Timely Decisions: Real-time market data enables users to make timely and informed trading decisions in a volatile market.
How: User Interactions and Preferences
Customizable Dashboards: Users appreciate being able to customize their dashboard view to highlight the most relevant information.
Intuitive Navigation: Simple and intuitive navigation is essential for users to access different features quickly and easily.
Define
Define
Define
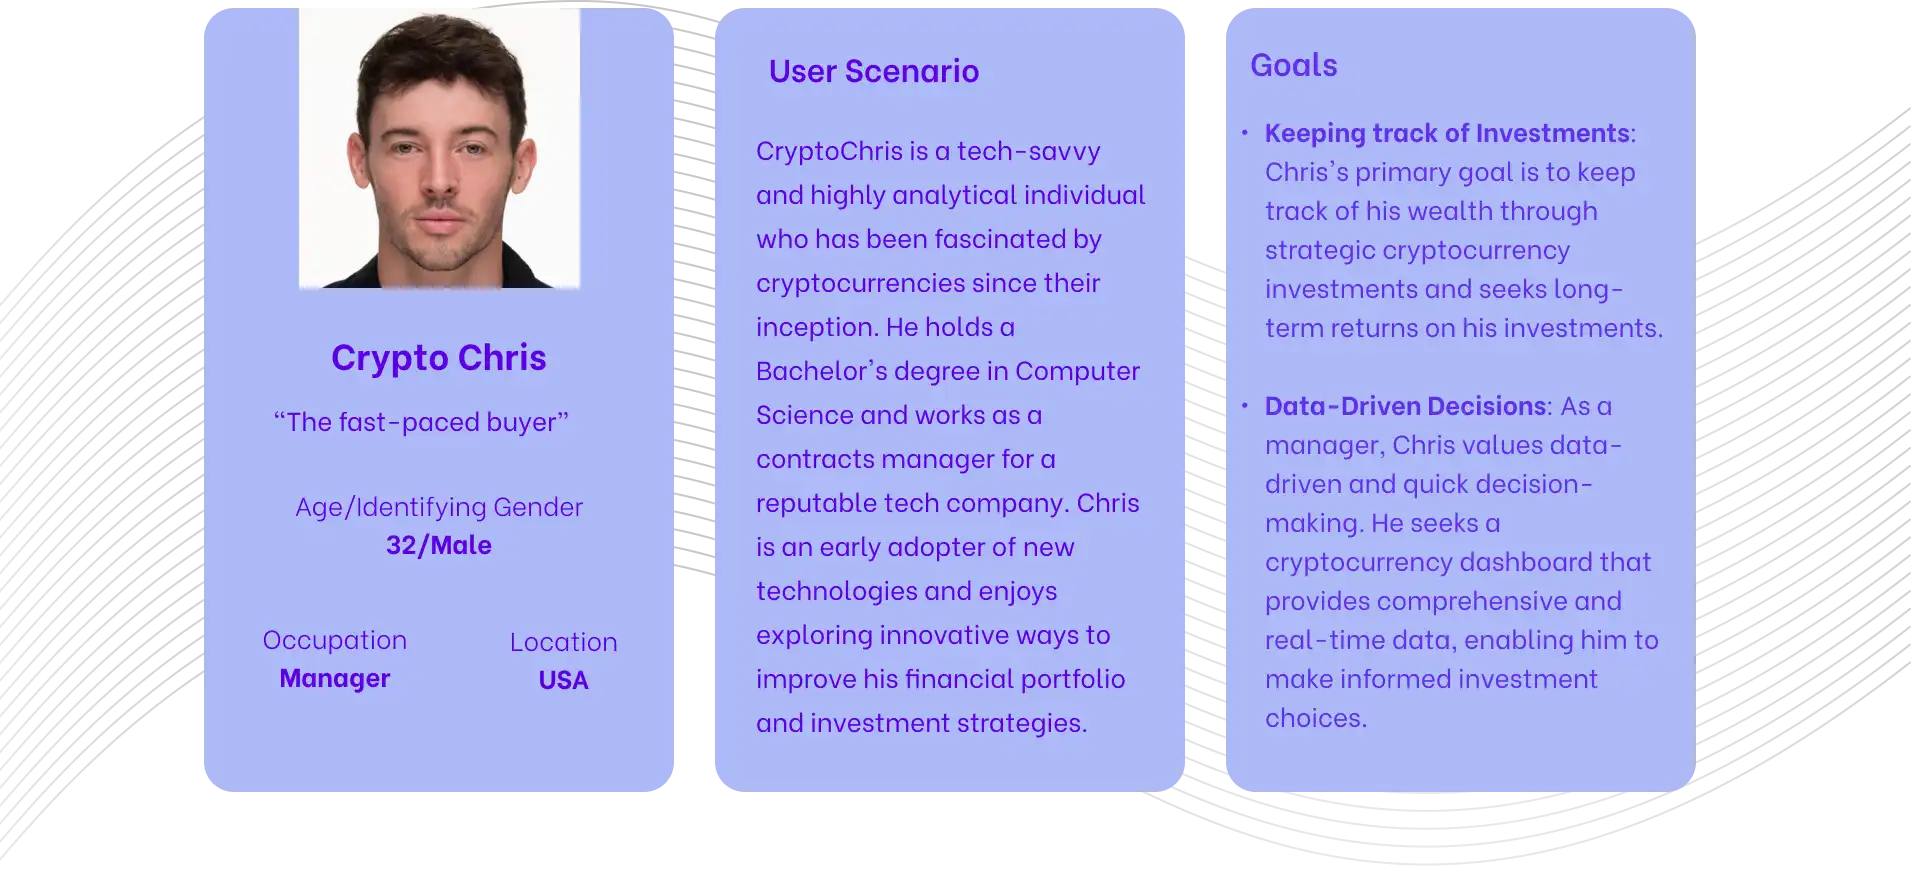
Based on research from various sources I gathered ideas about the user requirements and data points that need to be displayed and came up with a fictional persona in order to set the design context of who will be the target users for the dashboard design and for what purposes they will be using the dashboard for.
Based on research from various sources I gathered ideas about the user requirements and data points that need to be displayed and came up with a fictional persona in order to set the design context of who will be the target users for the dashboard design and for what purposes they will be using the dashboard for.
Based on research from various sources I gathered ideas about the user requirements and data points that need to be displayed and came up with a fictional persona in order to set the design context of who will be the target users for the dashboard design and for what purposes they will be using the dashboard for.
Ideating features
Ideating features
Based on the persona and looking at other relevant information on crypto market, decided to implement 4 most important features that are most useful to the user as primary functions and others as secondary functions.
Based on the persona and looking at other relevant information on crypto market, decided to implement 4 most important features that are most useful to the user as primary functions and others as secondary functions.
Based on the persona and looking at other relevant information on crypto market, decided to implement 4 most important features that are most useful to the user as primary functions and others as secondary functions.
Primary Functions
Primary Functions

Wireframing/ brainstorming sketches
Wireframing/ brainstorming sketches
Wireframing/ brainstorming sketches
Dashboard
Dashboard
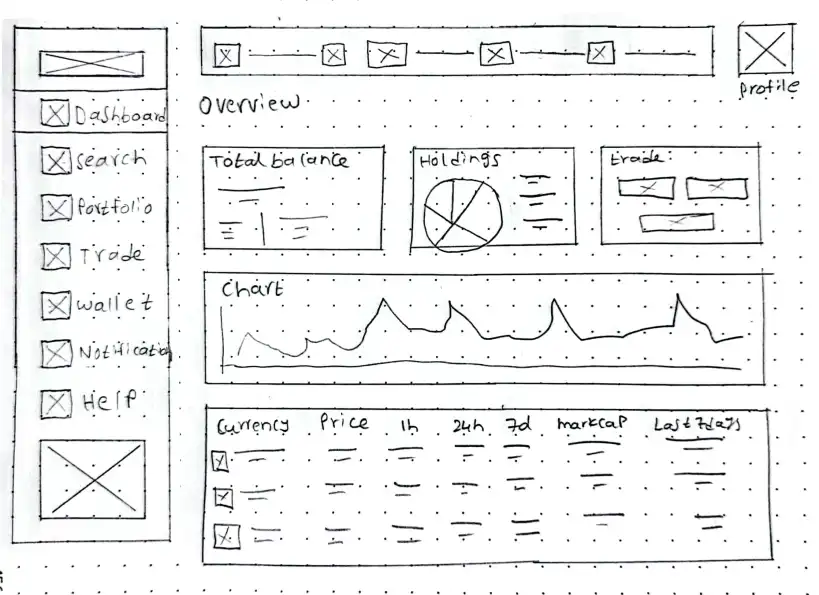
The dashboard page has some basic functions such a watchlist, recent transactions and status and latest news/ trends going around.
The dashboard page has some basic functions such a watchlist, recent transactions and status and latest news/ trends going around.
The dashboard page has some basic functions such a watchlist, recent transactions and status and latest news/ trends going around.
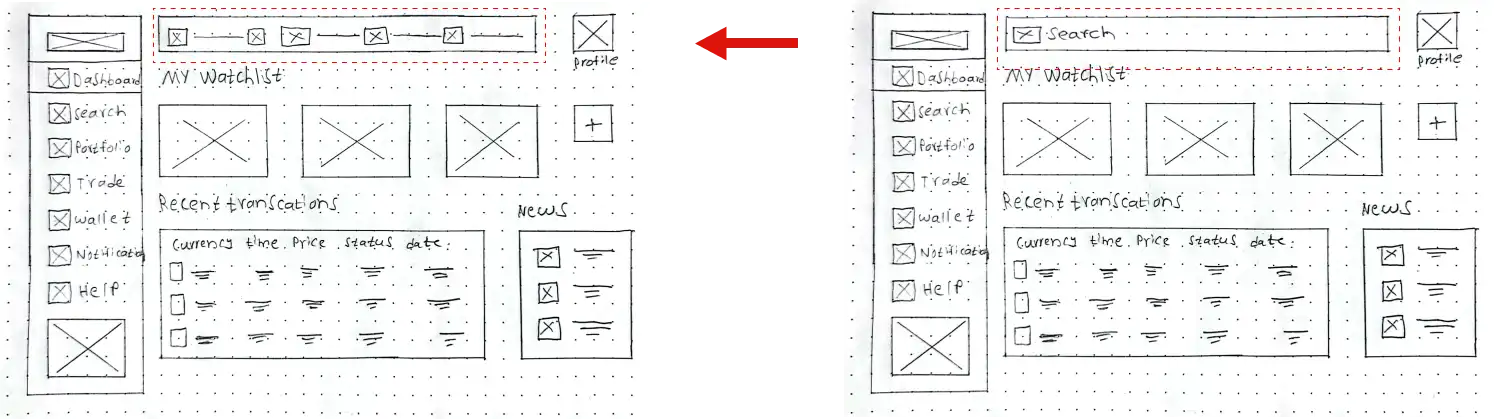
Initially planned to include a search bar in the dashboard screen however, in order to make it easy for the users to get a quick overview of the market trading volumes and trending coins etc decided to make the search an individual section page as shown bellow. Added an ticker tape in the place of search box to give more insights to the users.
Initially planned to include a search bar in the dashboard screen however, in order to make it easy for the users to get a quick overview of the market trading volumes and trending coins etc decided to make the search an individual section page as shown bellow. Added an ticker tape in the place of search box to give more insights to the users.
Search
Search
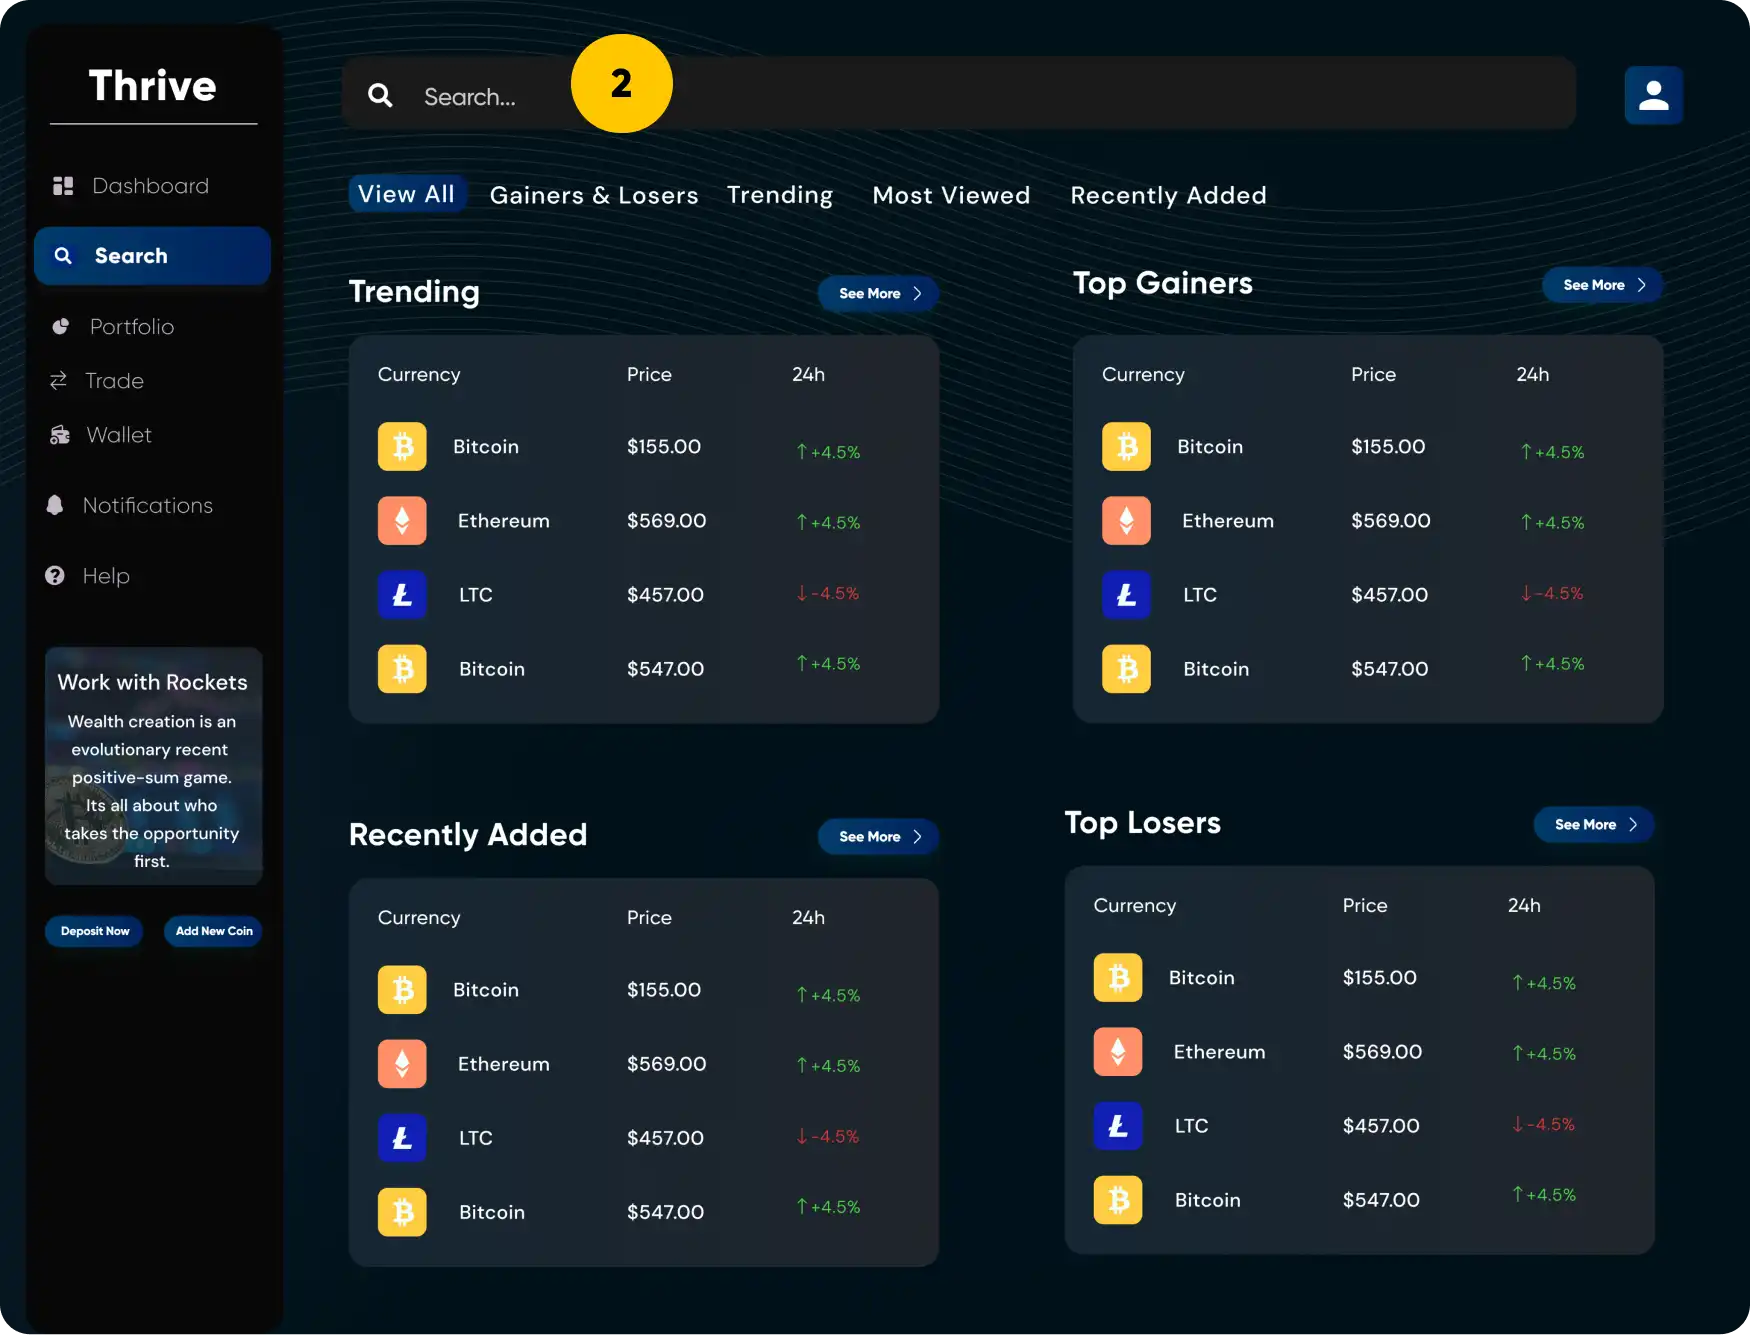
Included various filters and categories for users to scroll through to find the right options to invest.
Included various filters and categories for users to scroll through to find the right options to invest.
Included various filters and categories for users to scroll through to find the right options to invest.

Portfolio
Portfolio
In the portfolio page, the users can keep track of all the assets they posses with the help of the graphical representation format such as line graphs and pie charts and tabular formats.
In the portfolio page, the users can keep track of all the assets they posses with the help of the graphical representation format such as line graphs and pie charts and tabular formats.
In the portfolio page, the users can keep track of all the assets they posses with the help of the graphical representation format such as line graphs and pie charts and tabular formats.
High fidelity Design
High fidelity Design
High fidelity Design
Mood board
Mood board
Background
Cards Gradient Range
Buttons
Pending
Loss
Profit
Side panel

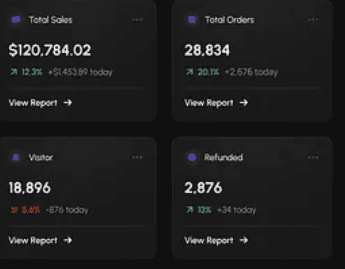
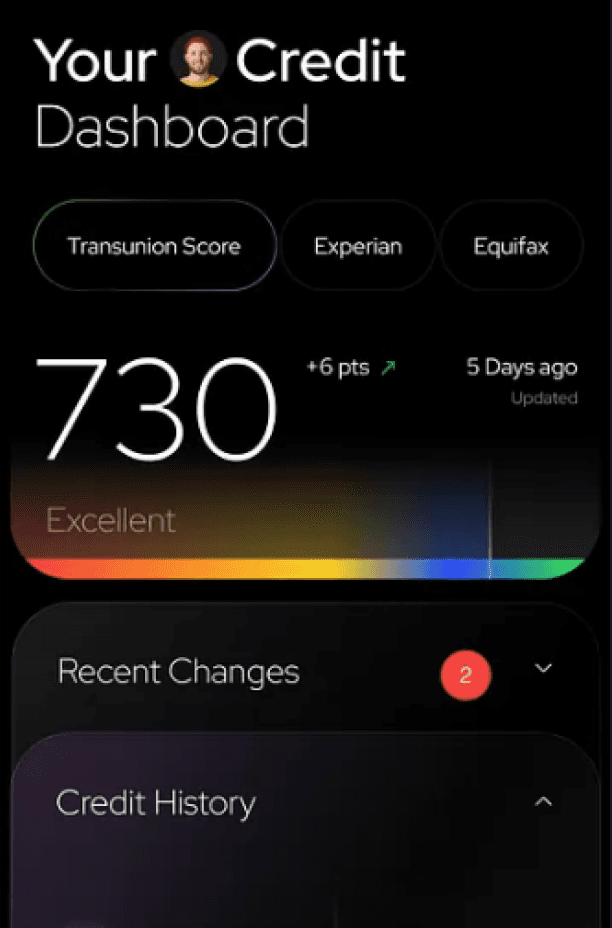

I decided to stick to a dark theme and explored various designs such as cards, graphs and charts for inspiration.
I decided to stick to a dark theme and explored various designs such as cards, graphs and charts for inspiration.
Background
Cards Gradient Range
Buttons
Pending
Loss
Profit
Side panel
Final Design
Final Design


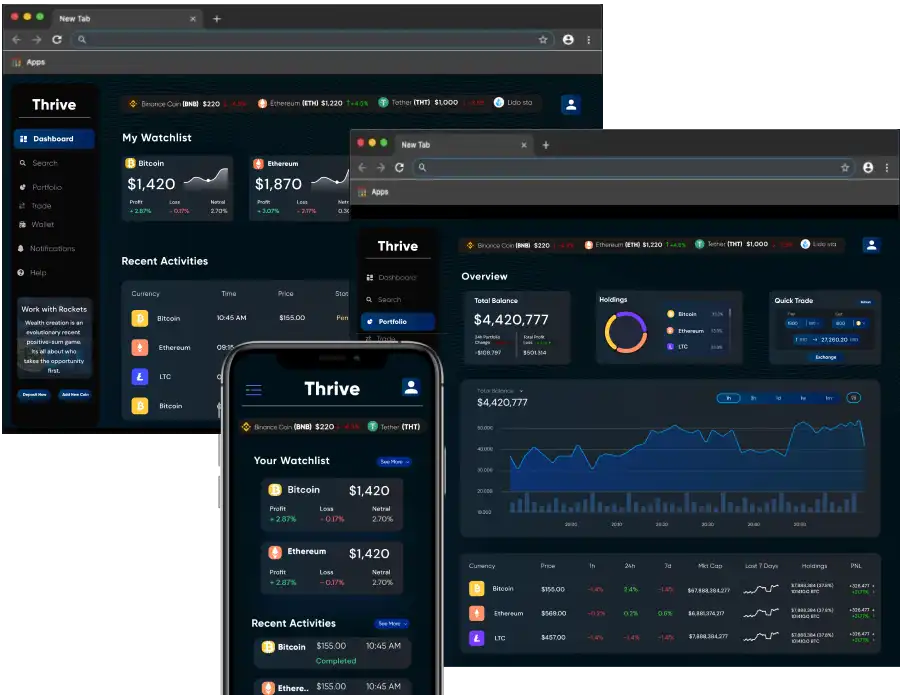
Mobile responsive state
Mobile responsive state